Predicting Household Utility Usage with Generalized Boosted Regression Modeling (GBM)
October 2025 (381 Words, 3 Minutes)
Overview
The goal of this project is to predict the household energy consumption for the the following year for the treatment and control groups using Gradient Boosting.
Domain Expertise
This project deals with standard economic time series data; my background being in economics, I am very familiar in dealing with this type of data and analysis.
Data Provenance
The professor provided us an uncleaned dataset that he sourced on the monthly electricity consumption for 23,456 households for the years 2010-2011.
We were provided the following variables for household characteristics:
-
hh_id: The unique id for each household -
year: The year the measurement was taken. Either 2010 and 2011. -
month: The month the measurement was taken. In the range of (4,8) April- August. -
zipcode: The anonymized zip code where the household is located. -
control: Whether the household and month combination is part of control group. 1 if yes, 0 if no. -
treatment: Whether the household and month combination is part of treatment group. 1 if yes, 0 if no. -
children: Whether the household has children or not. 1 if yes, 0 if no. -
hhsize2-5plus: Whether the household is in the size group of number of people in the home. 1 if yes, 0 if no. Household sizes 2- 5+. -
income2-9: Whether the household is in income categories <$20k, $20-30k, $30-40k, $40-50k, $50-75k, $75-100k,$100-125k, >$125k, respectively. 1 if yes, 0 if no. -
owner: Whether the resident owns the home. 1 if yes, 0 if no.
And the following variables for the observed energy consumption for each household:
-
lusage: Measured in log(kwh). The log of monthly electricity consumption for the given household. -
lusage1-6: Measured in log(kwh). For the months of April - September, 2009 (i.e. pre-sample period).
Technical Stack
This project was completed in R with the package gbm to model with gradient boosting.
Methods
The data was first cleaned and preprocessed. Rows with NA were removed, the dummy variables were converted to factors, and outliers were removed.
The monthly household energy consumption lusage is set as the response and is modeled by all variables excluding hh_id, year, and month. We model each treatment group separately with gradient boosting with a gaussian distribution where the total number of trees to be fit is 5000 and the depth between interactions is 3.
Results
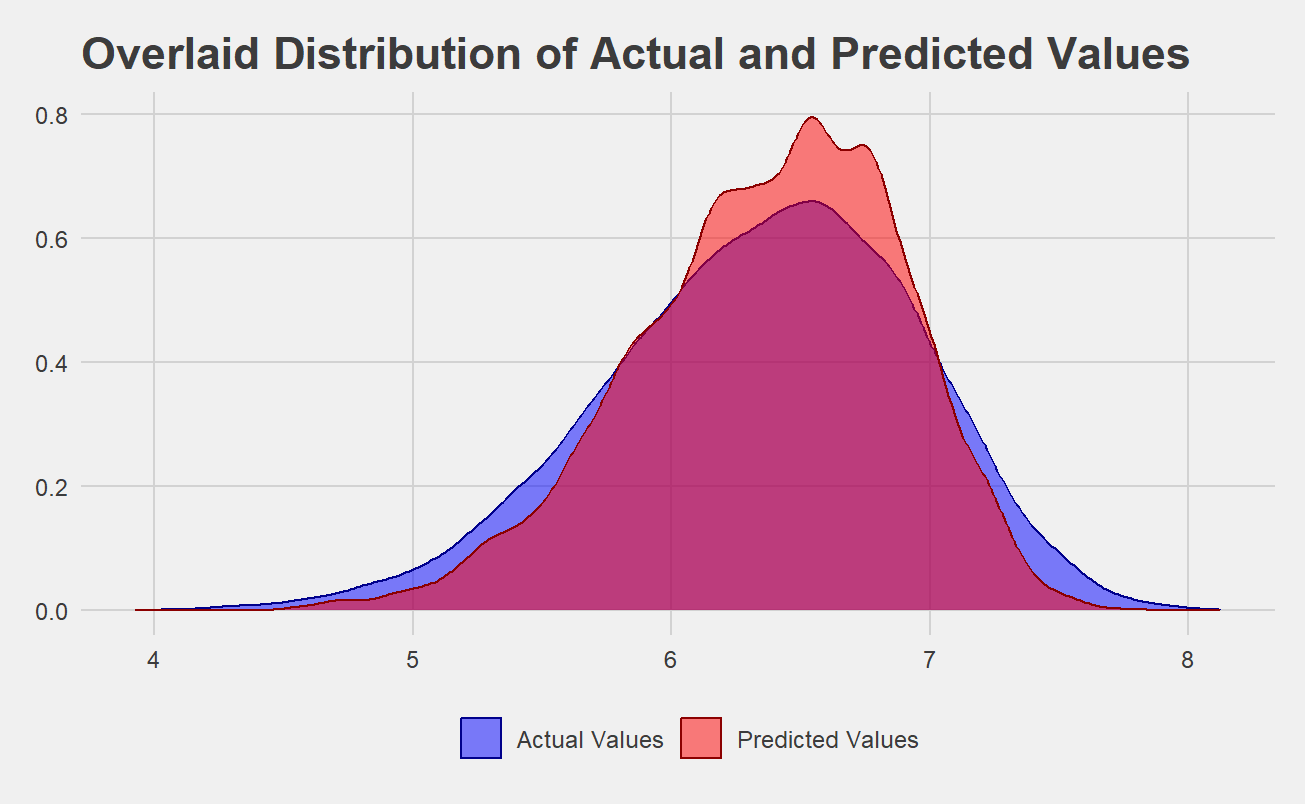
The true values of monthly household energy consumption for the 2011 treatment group of lusage range from [4.516,8.059], with a mean of 6.373. The predicted values using the gbm method have a slightly larger range of [3.927,8.123], with a relatively similar mean of 6.346.
Conclusion
We accurately predicted the distribution and range of values taken for the 2011 treatment group. It was not perfect, as expected, but offers us a fairly accurate prediction of a household’s energy consumption for the following year.
Other confounding variables including government mandated water limits were not accounted for and may be useful in improving future predictions.
