TravelAware: Your Commute Safety Assistant
March 2026 (360 Words, 3 Minutes)
 View Project File
Joint Effort with Pranav Agarwal, Sebastian Algharaballi-Yanow, David Assio, Satvik Bhatnagar, and Samar Vikas Save
View Project File
Joint Effort with Pranav Agarwal, Sebastian Algharaballi-Yanow, David Assio, Satvik Bhatnagar, and Samar Vikas Save
Overview
TravelAware addresses the gap between traditional navigation systems that prioritize speed/distance and travelers’ safety concerns. The application processes Los Angeles Police Department crime data (2020-present) to generate risk scores for potential routes, incorporating user demographics (age, gender) and travel time to provide personalized safety-weighted route recommendations. This prototype initially focused on automobile travel within LA County.
Domain Expertise
This project operates at the intersection of urban planning and navigation technology. We conducted exploratory analysis on Los Angeles crime patterns, identifying high-risk areas and demographic vulnerabilities. Central LA emerged as a significant concern with approximately 70,000 reported crimes in recent periods.
Data Provenance
Primary data source is the “Crime Data from 2020 to Present” dataset from the Los Angeles Police Department and City of Los Angeles, updated biweekly. Contains exact geolocation data (longitude/latitude) for each incident. The team removed records with missing location data (0°, 0° coordinates) and assumes the dataset accurately represents reported crime in LA County without manipulation from original police reports.
Technical Stack
Backend: Python with Flask, pandas, and PyTorch for data processing, crime analysis, and route preference calculations. Mapbox API for route generation and geographic coordinate conversion.
Frontend: Angular (TypeScript) framework with four main UI components: map display, user input fields, route information table, and demographic-based crime analysis table.
Methods
Data Processing: Applied rolling mean methodology (7-day and 30-day) to smooth crime data and reduce impact of anomalous events Risk Assessment: Calculated crime scores within 160-meter radius of potential routes, weighted by severity based on survey of 20 participants rating crime types 1-10.
Demographic Profiling: Identified top 3 relevant crime types per user profile, applying 20% higher weighting
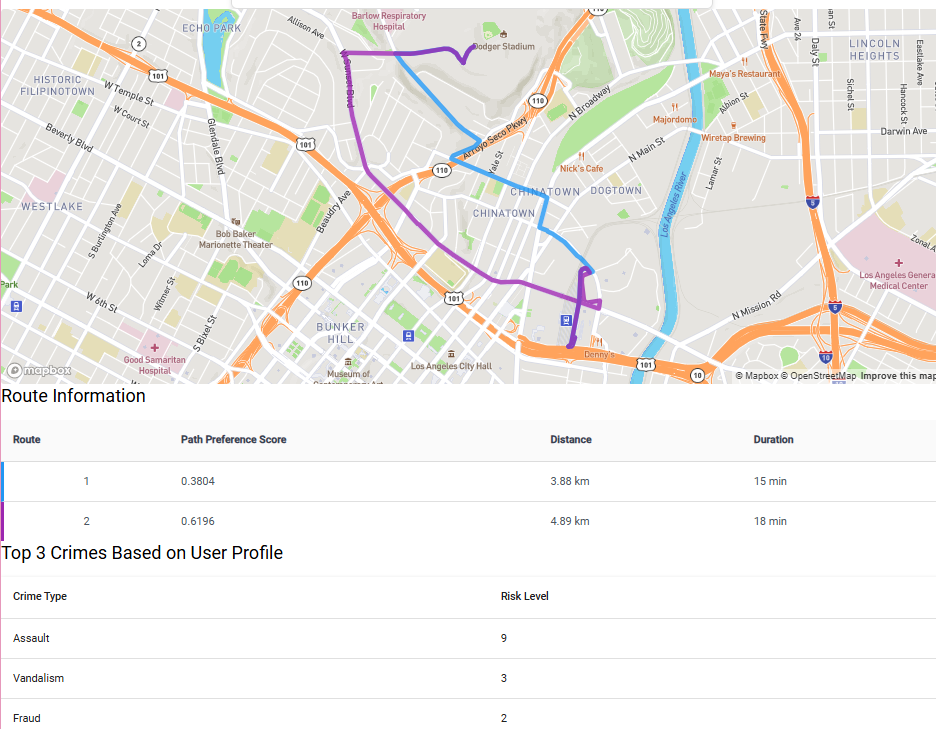
Route Scoring: Used formula combining user preference (p), route duration (d), and crime score (c): Path Preference Score = (p × 1/d) + ((1-p) × 1/c).
Results
TravelAware successfully generates multiple route options with safety-weighted scoring based on user preference. A case study from Dodger Stadium to LAX demonstrated how the safer route added approximately 10 minutes while significantly reducing exposure to high-crime areas. The system effectively balances user preferences between safety and speed through normalized preference scoring, with 94% of Central LA businesses located within 180 meters of high-crime zones highlighting the complexity of safety-based routing.
Conclusion
The project demonstrates the feasibility of incorporating public safety data into navigation systems while considering ethical implications for local businesses. However, expanding TravelAware to other metropolitan areas would require establishing partnerships with local law enforcement agencies to access high-quality crime data. The analysis revealed that the relationship between time of year and crime patterns could not be effectively incorporated due to limitations in the current dataset - more comprehensive temporal data collection would be essential for better predictive capabilities.
Despite these challenges, the framework could be applied to cities beyond Los Angeles as crime data reporting standards improve. Future enhancements could include real-time incident reporting, seasonal trend analysis, and weighted safety-impact modeling to better balance individual safety with community economic considerations.
These improvements would position TravelAware as a building block toward commercialized safety-aware navigation solutions.